Getting started
This is a quick getting started guide for the Python hips package.
Make a sky image
To draw a sky image from HiPS image tiles with the hips package, follow the following three steps:
Specify the sky image geometry you want by creating a
WCSGeometryobject:from astropy.coordinates import SkyCoord from hips import WCSGeometry geometry = WCSGeometry.create( skydir=SkyCoord(0, 0, unit='deg', frame='galactic'), width=2000, height=1000, fov="3 deg", coordsys='galactic', projection='AIT', )
Specify the HiPS survey you want. You just need to provide a valid HiPS survey ID.
A good address that lists available HiPS data is http://aladin.u-strasbg.fr/hips/list
hips_survey = 'CDS/P/DSS2/red'
Call the
make_sky_imagefunction to fetch the HiPS data and draw it, returning an object ofHipsDrawResult. By default a progress bar is shown for fetching and drawing HiPS tiles. For batch processing, this can be turned off by passing a keyword argument:progress_bar=False:from hips import make_sky_image result = make_sky_image(geometry, hips_survey, 'fits')
Of course, you could change the parameters to chose any sky image geometry and available HiPS survey you like!
Work with the result
The HipsDrawResult object from the last section makes it easy for you
to plot, save or analyse the sky image. To generate a quick-look plot of the sky image,
with rectangles outlining the HiPS tiles that were fetched and drawn to create the sky image:
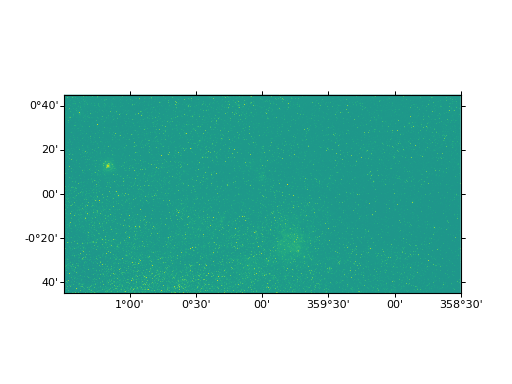
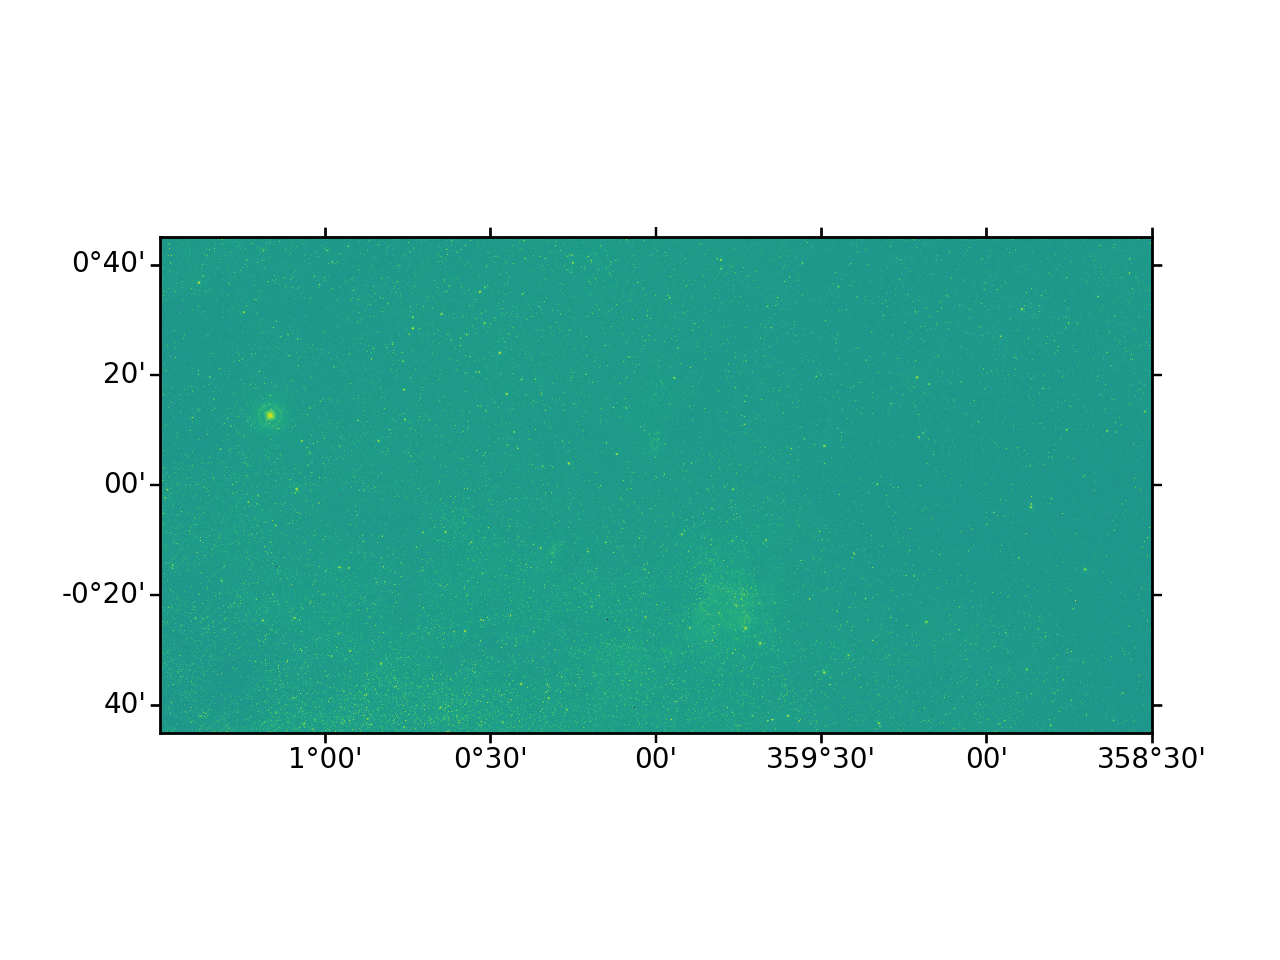
result.plot()
this will result in the following plot:
(Source code, png, hires.png, pdf)

To save the sky image to a file:
result.write_image('my_image.fits')
To analyse the data, or make a publication-quality plot, you can get the sky
image pixel data as a numpy.ndarray:
>>> result.image
and the sky image astropy.wcs.WCS mapping pixel to sky coordinates via:
>>> result.geometry.wcs
To print out summary information about the result:
>>> print(result)
The HipsDrawResult object also gives access to the HipsTile
objects that were used for drawing the sky image, as well as other things.
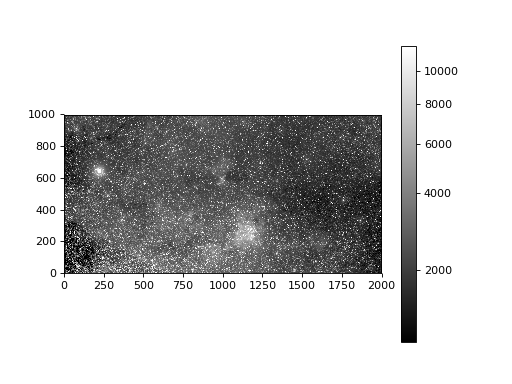
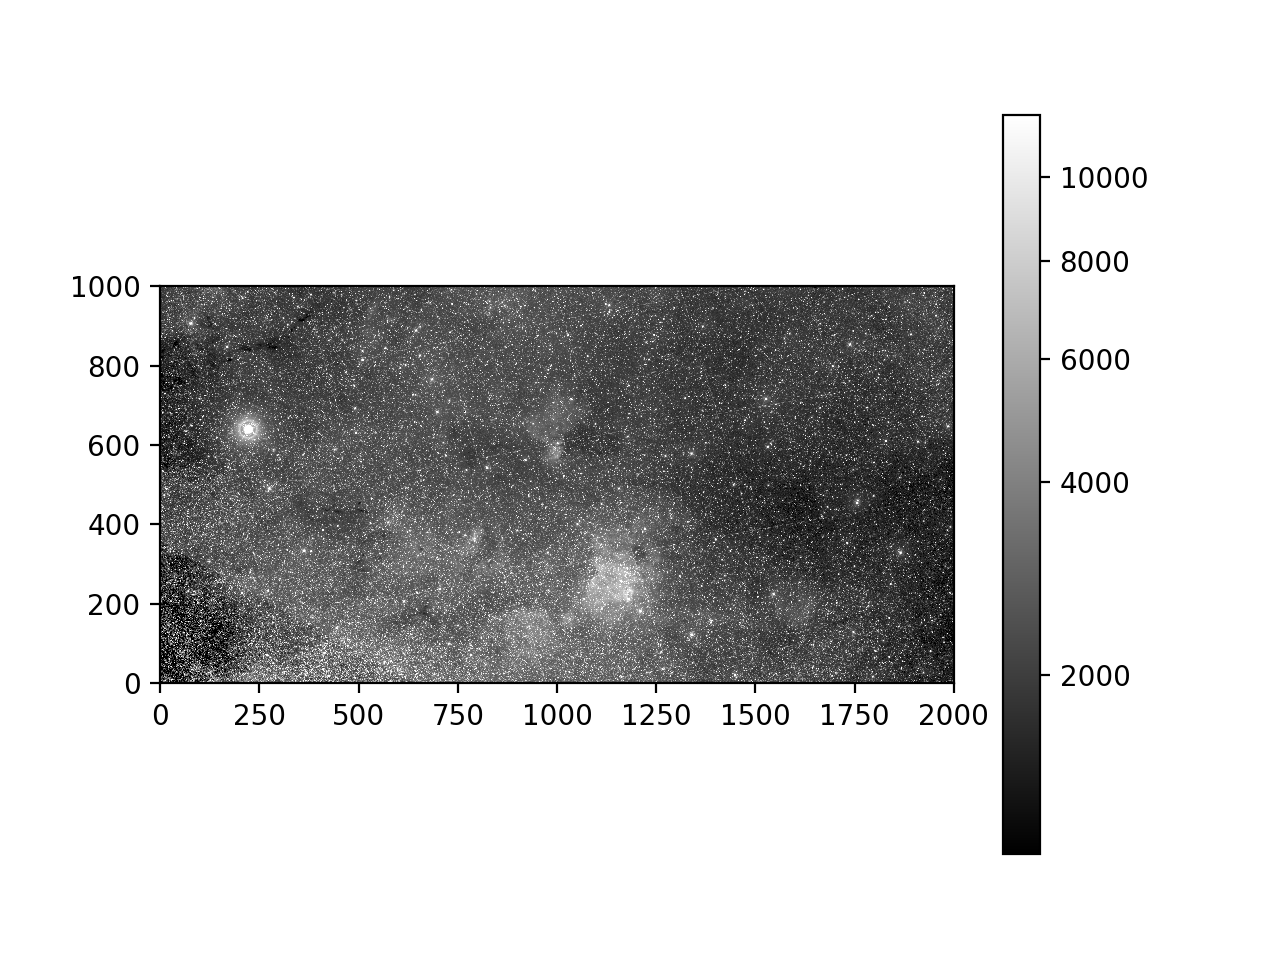
Plot using Astropy visualization toolkit
Astropy provides a framework for plotting astronomical images with coordinates. It builds on top of Matplotlib and provides functionalities such as image normalization (scaling and stretching), smart histogram plotting, RGB color image creation from separate images. The framework also allows for customization of plotting styles.
The example below is for the FITS format and controls the stretch of the image through normalization. For FITS tiles, the data type is either int16 or float32:
import matplotlib.pyplot as plt
from astropy.visualization.mpl_normalize import simple_norm

fig = plt.figure()
ax = fig.add_subplot(1, 1, 1)
im = ax.imshow(result.image, origin='lower', norm=norm, cmap='gray')
fig.colorbar(im)
(Source code, png, hires.png, pdf)

RGB tiles can be plotted in much the same way as above, however, it is uncommon to apply an extra stretch in this case. For jpg and png tiles, the data type is uint8.
Note
For png tiles, there are four channel i.e. RGBA. The alpha channel is used for controlling the transparency of the image.
The example provided here is trivial. Astropy provides numerous other features, customizability options, and in-depth examples. Please see their documentation at: https://docs.astropy.org/en/stable/visualization
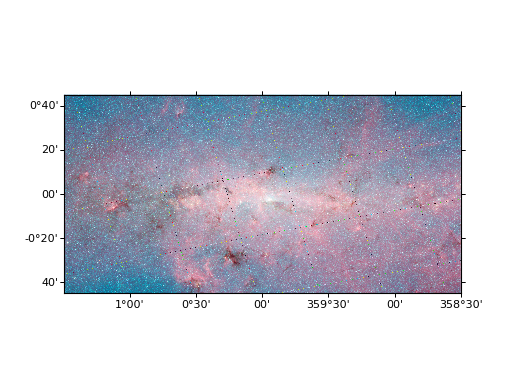
Make a color sky image
HiPS supports color images in jpg and png format.
Making a color sky image works the same as the grayscale image example above,
except that you get back a 3-dim Numpy array with (R, G, B) channels for jpg
or (R, G, B, A) channels (A is transparency) for png.
Here’s an example using jpg and http://alasky.u-strasbg.fr/Fermi/Color:
(Source code, png, hires.png, pdf)
HiPS data
We plan to implement functionality to manage HiPS data, i.e. download it and cache it on a local disk.
This isn’t available yet, at the moment we simply use Python lists of HipsTile objects,
which have a read method for a given filename and a fetch method for a given URL.
More advanced examples
This package is under heavy development, it’s changing quickly.
We’ll add advanced examples and detailed documentation once things have stabilised a bit.
For now, if you know Python, you can look at the code and tests to see what’s available: https://github.com/hipspy/hips
What next?
That’s it, now you’ve seen the main features of the hips package.
Note that there is API documentation explaining all available functions, classes and parameters.
If you have any questions, or find something not working or a missing feature, please get in touch by posting on our Github issue tracker.